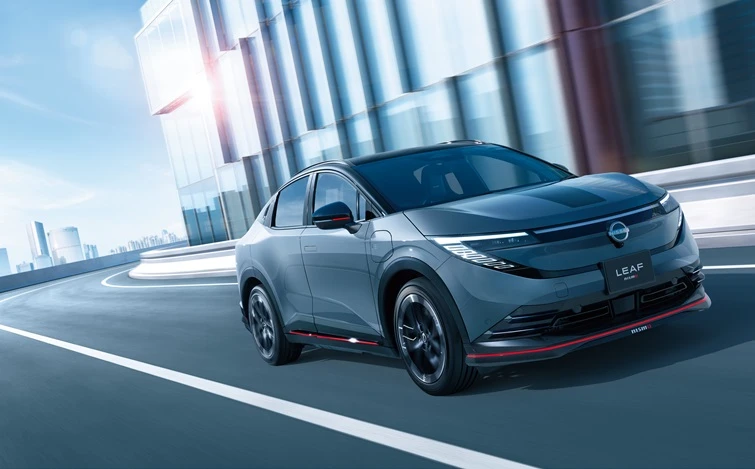
YOKOHAMA, Japan ‐ Nissan Motor Co., Ltd. today, announced sales, production and export figures for August 2026.
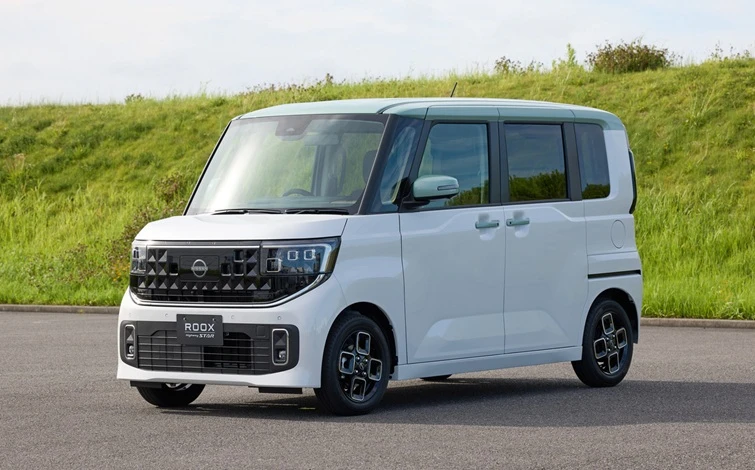
Japan sales increased by 9.7% year-on-year. Roox recorded strong sales of 6,093 units, ranking 10th in Japan's monthly vehicle sales rankings including kei cars. In the U.S., under the strategic shift toward retail sales, Rogue, Pathfinder and Frontier continue to drive strong sales, and the recently introduced all-new Rogue Hybrid will become a strong addition to the portfolio catering to the evolving market dynamics and customer needs. In China, while overall market environment continues to be challenging, the newly unveiled all-new NX7 SUV is generating positive interest from customers as Nissan is steadily advancing its transition toward New Energy Vehicles (NEVs). Nissan remains focused on improving competitiveness and creating a stronger foundation for future growth.
Overall, global sales volume for August was 207,162 units, down 17.5% year-on-year, while global production volume was 191,524 units, down 19.5% year-on-year. Additionally, the number of units exported from Japan was 26,610, down 3.7% year-on-year.
1. Global Sales
| Aug. 2026 (vehicles) |
Year-on-year change (%) |
April-Aug. 2026 (vehicles) |
Year-on-year change (%) |
April-Aug. 2025 (vehicles) |
|||
| Japan (incl. minivehicles) | 27,810 | +9.7 | 151,912 | +3.3 | 147,094 | ||
| North America | 105,470 | -7.1 | 540,034 | +0.7 | 536,274 | ||
| US | 75,147 | -7.1 | 393,814 | +4.6 | 376,549 | ||
| Mexico | 22,464 | -5.6 | 106,274 | -4.0 | 110,683 | ||
| Europe | 13,438 | -8.6 | 98,644 | -12.1 | 112,179 | ||
| China | 28,275 | -51.9 | 159,376 | -41.9 | 274,251 | ||
| Others | 32,169 | -17.1 | 155,695 | -17.2 | 188,055 | ||
| Sales outside Japan | 179,352 | -20.5 | 953,749 | -14.1 | 1,110,759 | ||
| Global sales | 207,162 | -17.5 | 1,105,661 | -12.1 | 1,257,853 | ||
- Global sales in August declined 17.5% from a year earlier.
- Sales outside Japan declined 20.5% from a year earlier.
2. Global Production
| Aug. 2026 (vehicles) |
Year-on-year change (%) |
April-Aug. 2026 (vehicles) |
Year-on-year change (%) |
April-Aug. 2025 (vehicles) |
||
| Japan | 37,152 | +9.2 | 230,487 | +5.1 | 219,364 | |
| US | 54,791 | +19.3 | 244,606 | +32.0 | 185,333 | |
| Mexico | 48,615 | -26.0 | 216,332 | -23.7 | 283,452 | |
| UK | 16,737 | +4.0 | 93,425 | -6.2 | 99,623 | |
| China | 15,474 | -73.3 | 137,714 | -46.5 | 257,270 | |
| Others | 18,755 | +2.6 | 92,153 | *-27.3 | 126,824 | |
| Global production | 191,524 | -19.5 | 1,014,717 | *-5.9 | 1,171,866 | |
Notes:
1) “Others” represents the combined total of production in markets including Taiwan, Thailand, South Africa, Brazil, India, Egypt, and Argentina (excluding complete knocked-down production).
2) *Following the sale of shares in Renault Nissan Automotive India Pvt. Ltd. (RNAIPL), the figures for India now include only Nissan-produced models.
Year-on-year comparisons are made against volumes excluding Renault production.
- Global production in August declined 19.5% from a year earlier.
3. Details on Japan sales, production and export
Sales
| Aug. 2026 (vehicles) |
Year-on-year change (%) |
April-Aug. 2026 (vehicles) |
Year-on-year change (%) |
April-Aug. 2025 (vehicles) |
|||
| Passenger vehicles | 13,895 | +14.9 | 73,603 | +2.6 | 71,720 | ||
| Commercial vehicles | 2,169 | -12.8 | 13,001 | -19.5 | 16,148 | ||
| Registration | 16,064 | +10.1 | 86,604 | -1.4 | 87,868 | ||
| Minivehicles | 11,746 | +9.2 | 65,308 | +10.3 | 59,226 | ||
| Total | 27,810 | +9.7 | 151,912 | +3.3 | 147,094 | ||
Note:
1) Japan sales are categorized as passenger vehicles and commercial vehicles based on chassis.
- Sales including Minivehicles in Japan surpassed year-earlier results by 9.7%.
・Sales of registered vehicles in Japan surpassed year-earlier results by 10.1%.
・Minivehicle sales in Japan surpassed year-earlier results by 9.2%.
Production
| Aug. 2026 (vehicles) |
Year-on-year change (%) |
April-Aug. 2026 (vehicles) |
Year-on-year change (%) |
April-Aug. 2025 (vehicles) |
|||
| Passenger vehicles | 33,992 | +14.0 | 208,969 | +6.5 | 196,238 | ||
| Commercial vehicles | 3,160 | -24.7 | 21,518 | -7.0 | 23,126 | ||
| Production in Japan | 37,152 | +9.2 | 230,487 | +5.1 | 219,364 | ||
| Production outside Japan | 154,372 | -24.3 | 784,230 | *-17.7 | 952,502 | ||
| Global production | 191,524 | -19.5 | 1,014,717 | *-5.9 | 1,171,866 | ||
- Production in Japan surpassed year-earlier results by 9.2%.
- Production outside Japan declined 24.3% from a year earlier.
Export
| Aug. 2026 (vehicles) |
Year-on-year change (%) |
April-Aug. 2026 (vehicles) |
Year-on-year change (%) |
April-Aug. 2025 (vehicles) |
||||
| North America | 12,736 | -3.0 | 71,693 | +22.3 | 58,600 | |||
| Europe | 2,592 | -28.4 | 8,347 | -51.3 | 17,126 | |||
| Others | 11,282 | +3.6 | 57,432 | +3.2 | 55,637 | |||
| Total exports from Japan | 26,610 | -3.7 | 137,472 | +4.7 | 131,363 | |||
Notes:
1) Exports are the total of complete built-up and complete knocked-down vehicles (based on data from JAMA).
2) Export regions are based on JAMA geographic divisions. (Mexico is included in “Others.”)
- Exports from Japan in August declined 3.7% from a year earlier.
###
For more information about our products, services and commitment to sustainable mobility, visit
nissan-global.com. You can also follow us on Facebook, Instagram, X and LinkedIn and see all our latest videos on YouTube.